Waste Factor: A New Metric for Evaluating Power Efficiency in Any Cascade

Theodore (Ted) Rappaport

Focus: information and communication technology uses 4–6% of global electricity, yet no standard metric shows where along a signal path that power is wasted. The Waste Factor (W), also denoted as Waste Figure (WF) in dB, is one metric for any communication system, from a single circuit to a full network. The project defines W, extends W to multiple-input multiple-output (MIMO) systems, data centers, radio access networks, relays and fixed wireless access, and uses W to compare frequency bands.

  1. Why a new metric
  2. Definition
  3. MISO, SIMO and MIMO systems
  4. Data centers
  5. Radio access networks from 3.5 to 140 GHz
  6. Relays and fixed wireless access
  7. From Friis’s 1944 noise figure to the Waste Factor
Energy efficiencyWaste FactorGreen communicationsRadio access networksmmWave and sub-THzRelays and FWA
Prof. Rappaport on Waste Figure, a new figure of merit for sustainable circuits and systems (IEEE MTT-S).

Why a new metric

Information and communication technology uses 4–6% of global electricity (UK POST), and artificial intelligence (AI) adds more: Goldman Sachs projects a 160% increase in power demand, and a ChatGPT request uses 2.9 Wh against 0.3 Wh for a Google search (IEA, Electricity 2024). In cellular networks the radio access network (RAN) uses 76% of operator energy (Rappaport et al., OJ-COMS 2024). Standard efficiency metrics change with traffic load and do not show where along the signal path power is wasted.

Prof. Rappaport, Energy Sustainability and the Impending Communications Power Consumption Tidal Wave, Purdue University, May 1, 2025.
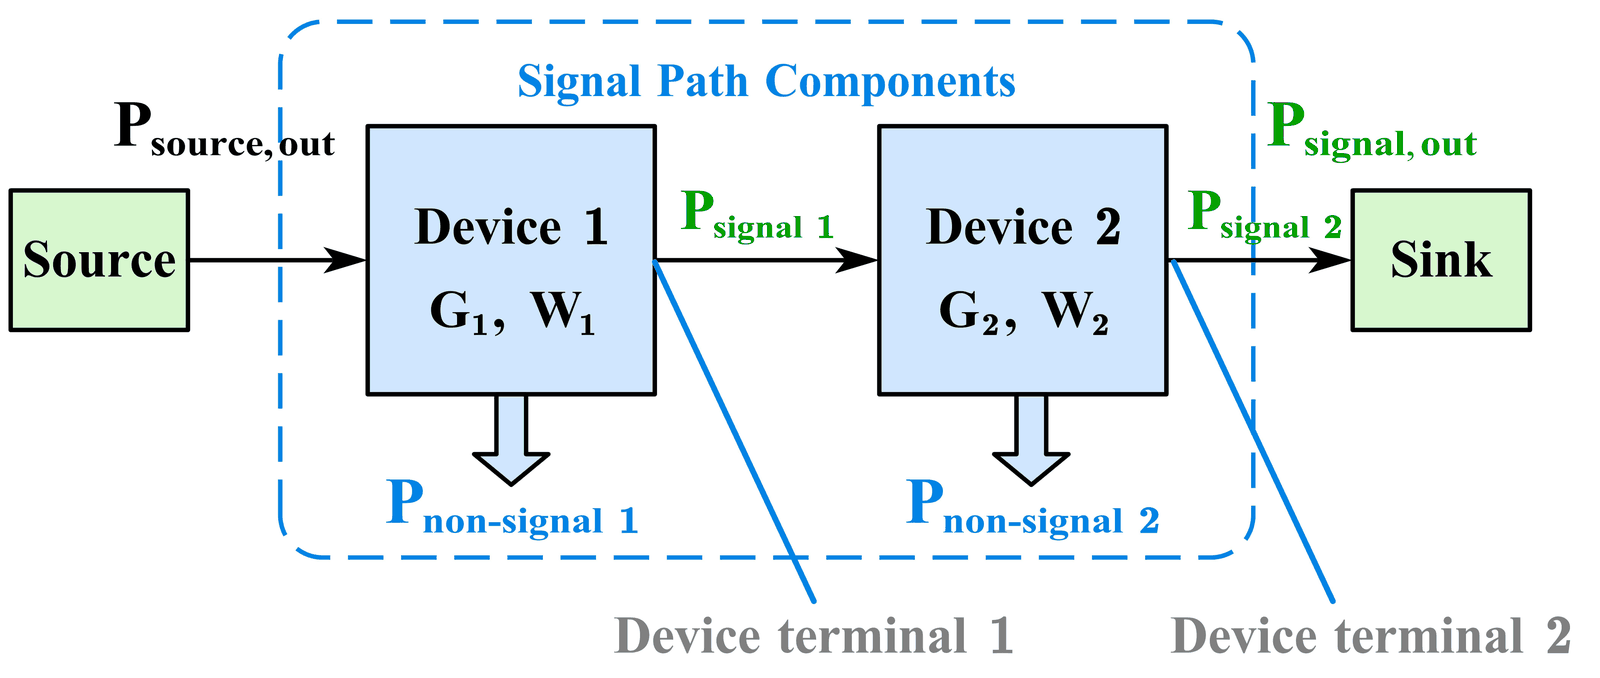
Waste Factor splits the power each device consumes into signal-path and non-signal parts; cascading devices from source to sink gives the system W (Ying, Shakya, Poddar and Rappaport, IEEE GLOBECOM 2023).

Definition

W is the power consumed along the signal path divided by the signal power delivered at the output; the Waste Figure is 10 log10 W. W = 1 (0 dB) means no waste, and a passive part or channel has W equal to its loss. Stages combine with Friis’s noise-figure cascade rule, but referred to the output, so the stage nearest the sink dominates: in a homodyne transmitter, halving the efficiency of the radio-frequency (RF) amplifier raises W from 2.20 to 4.12 (Ying et al., GLOBECOM 2023; Rappaport, Ying & Shakya, Microwave Journal 2024).

Waste Factor splits the power each device consumes into signal-path and non-signal parts; cascading devices from source to sink gives the system W (Ying, Shakya, Poddar and Rappaport, IEEE GLOBECOM 2023).

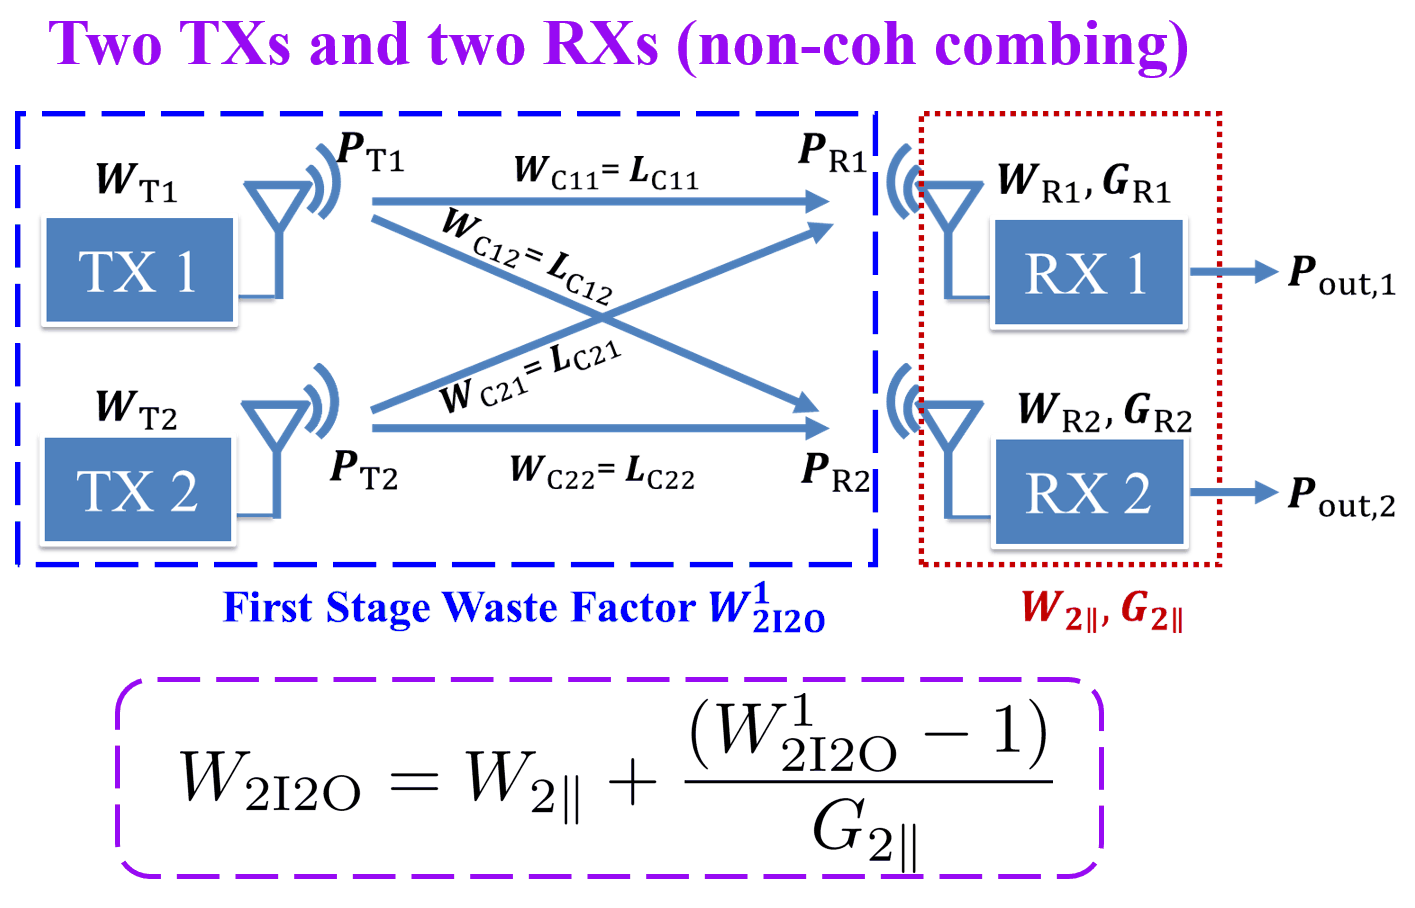
In a two-input, two-output MIMO system, transmitter and channel waste factors form a first-stage W that cascades with the parallel receivers (Ying, Shakya and Rappaport, IEEE GLOBECOM 2024).

MISO, SIMO and MIMO systems

The GLOBECOM 2024 paper gives the first W analysis of parallel systems. A MIMO system is treated as cascaded multiple-input single-output (MISO) or single-input multiple-output (SIMO) stages, combined at each interface non-coherently (powers add) or coherently (amplitudes add); a radio unit is modeled as SIMO and a user device as MISO. In a 28 GHz coordinated multipoint simulation with 512 users and 1 to 20 base stations, the system Waste Figure drops steeply as base stations are added, then levels off (Ying et al., GLOBECOM 2024).

In a two-input, two-output MIMO system, transmitter and channel waste factors form a first-stage W that cascades with the parallel receivers (Ying, Shakya and Rappaport, IEEE GLOBECOM 2024).

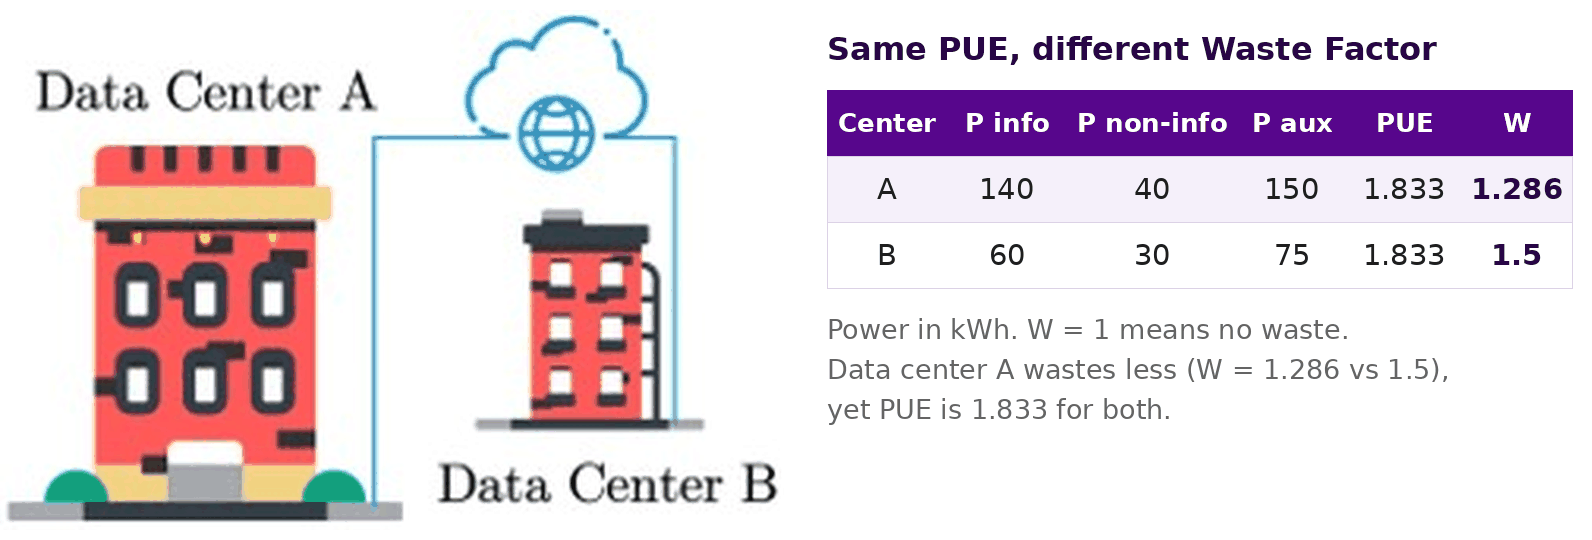
Two data centers with the same PUE (1.833) have different Waste Factors, 1.286 and 1.5, so W identifies the one that wastes less power (Ying, Shakya, Poddar and Rappaport, IEEE GLOBECOM 2023).

Data centers

Power usage effectiveness (PUE), total facility power over information technology (IT) power, cannot separate power that moves information from power that does not. W maps a data center onto the cascade: routers, switches and firewalls form the information path, processors, memory and storage are non-signal power, and cooling and power distribution are non-path power. Two data centers with the same PUE of 1.833 have W of 1.286 and 1.5, so W identifies the more efficient one (Ying et al., GLOBECOM 2023).

Two data centers with the same PUE (1.833) have different Waste Factors, 1.286 and 1.5, so W identifies the one that wastes less power (Ying, Shakya, Poddar and Rappaport, IEEE GLOBECOM 2023).

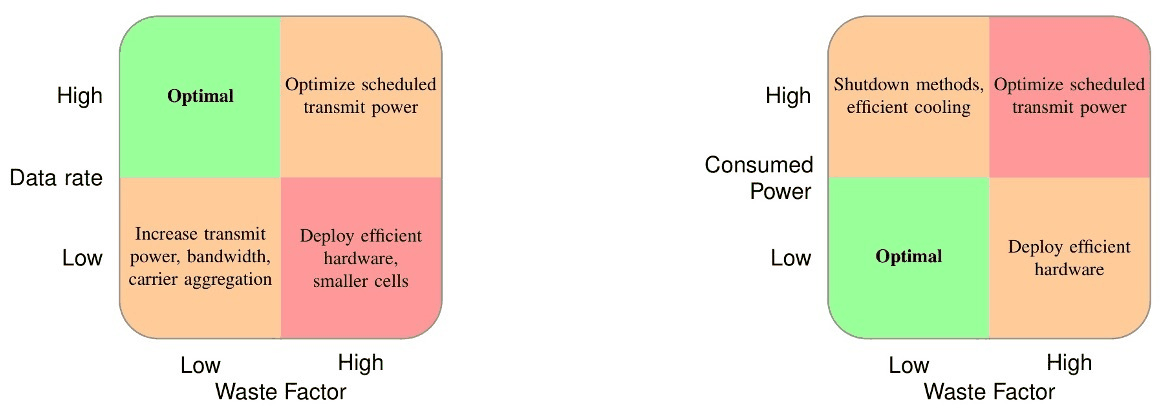
Pairing data rate or consumed power with W maps each operating condition to an energy-saving action (Rappaport et al., IEEE OJ-COMS 2024).

Radio access networks from 3.5 to 140 GHz

Efficiency metrics from ETSI, ITU and 3GPP depend on traffic load; W does not: field data from 7500 radio units give W = 3.5 at every output power. In a simulated distributed multi-user MIMO (MU-MIMO) downlink with 1024 users and directional antennas, 20 base stations at 28 GHz give a 12 dB lower Waste Figure than at 3.5 GHz (Rappaport et al., OJ-COMS 2024). Over a 100 m line-of-sight downlink, 140 GHz delivers 2.18 Gb/J against 0.99 Gb/J at 28 GHz (Kanhere et al., IEEE Wireless Commun. 2022). Paired with data rate or consumed power, W maps each operating condition to an energy-saving action.

Pairing data rate or consumed power with W maps each operating condition to an energy-saving action (Rappaport et al., IEEE OJ-COMS 2024).

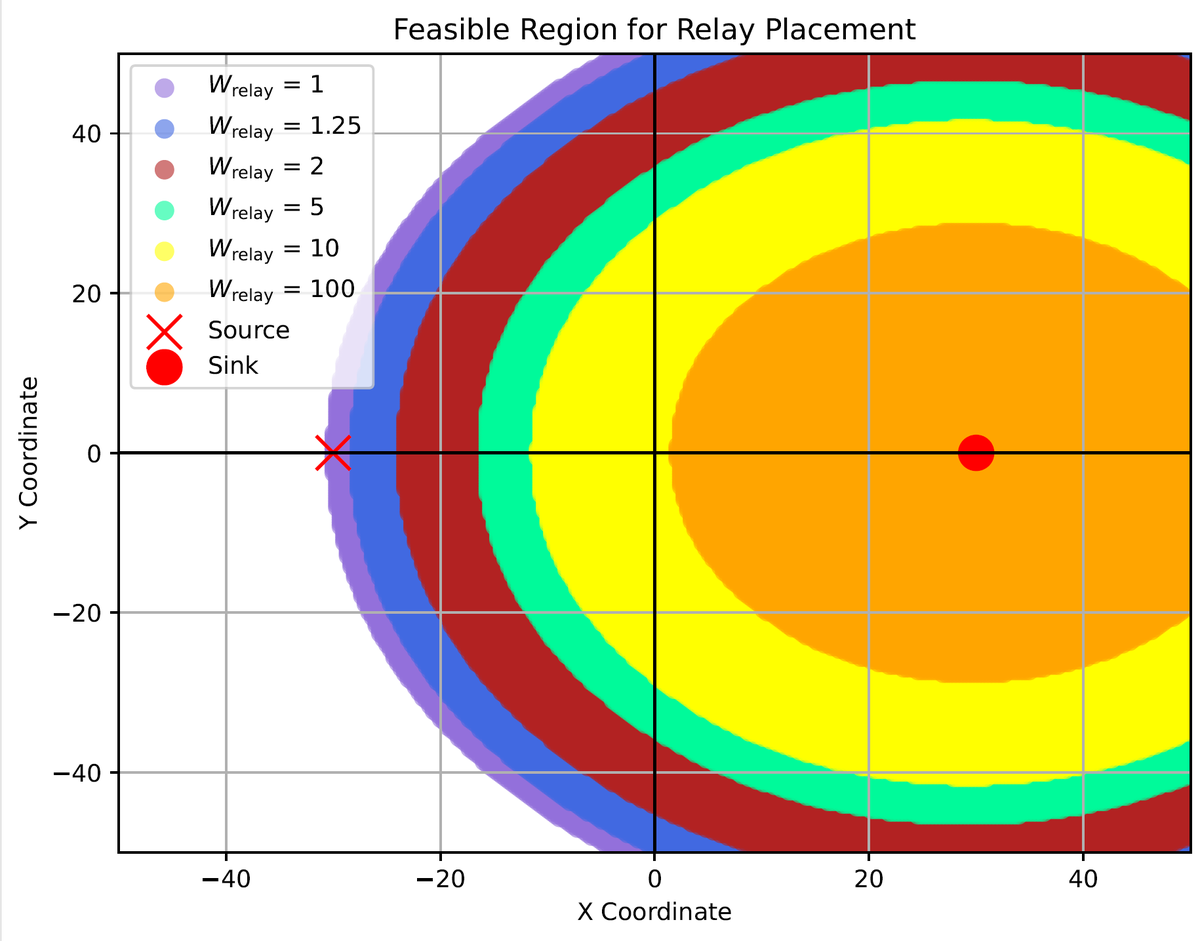
The region where a relay saves energy over a direct link grows as the Waste Factor of the relay transmitter falls (Sevim et al., npj Wireless Technology 2025).

Relays and fixed wireless access

Adding W to the consumption factor gives the minimum energy per bit of a link, which reduces to Shannon’s limit when W = 1 and there is no non-path power. A closed-form rule tells when a relay saves energy over a direct link: the useful region grows with relay receiver gain and shrinks as the W of the relay transmitter rises. In the fixed wireless access case study, it shrinks under uplink-heavy traffic and grows under downlink-heavy traffic; reconfigurable intelligent surfaces (RIS) fit the model as passive relays (Sevim et al., npj Wireless Technology 2025).

The region where a relay saves energy over a direct link grows as the Waste Factor of the relay transmitter falls (Sevim et al., npj Wireless Technology 2025).

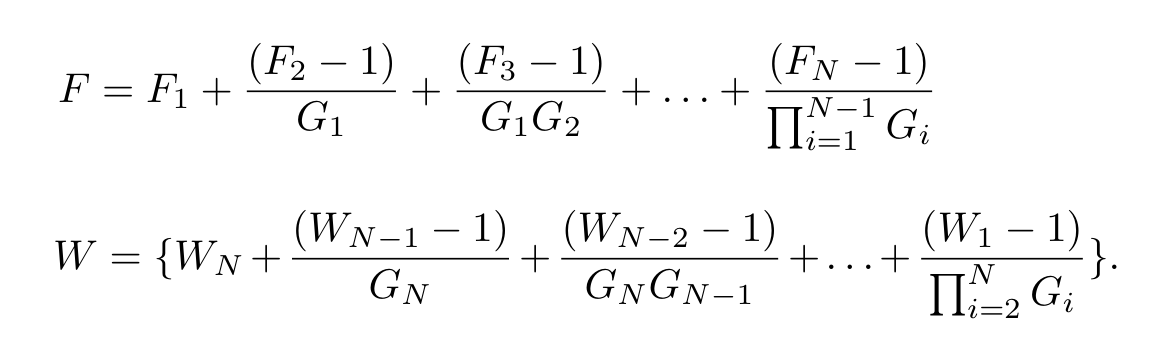
Friis's 1944 cascade noise factor (top) and the cascade Waste Factor (bottom) share one form, but W is referred to the output (Ying et al., IEEE GLOBECOM 2023).

From Friis's 1944 noise figure to the Waste Factor

Friis’s noise factor gave a cascade rule for added noise (Friis, Proc. IRE 1944); W applies the same form to wasted power. The precursor of W is the consumption factor, the maximum data rate per watt consumed (Murdock & Rappaport, 2011), whose power-efficiency factor showed that the relay choice depends on source and relay transmitter efficiencies (Murdock & Rappaport, IEEE JSAC 2014). For a fixed antenna aperture, millimeter-wave (mmWave) and terahertz (THz) bands give more bits per second per watt than sub-6 GHz (Rappaport et al., IEEE Access 2019). W was named in 2022 as the reciprocal of the power-efficiency factor.

Friis's 1944 cascade noise factor (top) and the cascade Waste Factor (bottom) share one form, but W is referred to the output (Ying et al., IEEE GLOBECOM 2023).

Faculty

Theodore (Ted) Rappaport

Students

Mingjun YingDipankar Shakya

Theoretical foundations of waste factor and waste figure with applications to fixed wireless access and relay systems N. Sevim, M. Ibrahim, S. Ekin, and T. S. Rappaport npj Wirel. Technol, 2025 Waste figure and waste factor: New metrics for evaluating power efficiency in any circuit or cascade T. S. Rappaport, M. Ying, and D. Shakya Microwave Journal, 2024 Using Waste Factor to Optimize Energy Efficiency in Multiple - Input Single - Output (MISO) and Multiple - Input Multiple - Output (MIMO) Systems M. Ying, D. Shakya, and T. S. Rappaport IEEE GLOBECOM, 2024 Waste Factor and Waste Figure: A Unified Theory for Modeling and Analyzing Wasted Power in Radio Access Networks for Improved Sustainability T. S. Rappaport, M. Ying, N. Piovesan, A. De Domenico, and D. Shakya IEEE Open Journal of the Communications Society, 2024 Waste Factor: A New Metric for Evaluating Power Efficiency in any Cascade M. Ying, D. Shakya, H. Poddar, and T. S. Rappaport IEEE GLOBECOM, 2023 A power efficiency metric for comparing energy consumption in future wireless networks in the millimeter wave and terahertz bands O. Kanhere, H. Poddar, Y. Xing, D. Shakya, S. Ju, and T. S. Rappaport IEEE Wirel. Commun, 2022 Wireless Communications and Applications Above 100 GHz: Opportunities and Challenges for 6G and Beyond T. S. Rappaport, Y. Xing, O. Kanhere, S. Ju, A. Madanayake, S. Mandal, A. Alkhateeb, and G. C. Trichopoulos IEEE Access, 2019 Consumption factor and power efficiency factor: A theory for evaluating the energy efficiency of cascaded communication systems J. N. Murdock and T. S. Rappaport IEEE J. Sel. Areas Commun, 2014 Consumption factor: A figure of merit for power consumption and energy efficiency in broadband wireless communications J. N. Murdock and T. S. Rappaport IEEE GLOBECOM Workshops, 2011 Noise Figures of Radio Receivers H. T. Friis Proc. IRE, 1944